
Your Break-Even ACoS Drops on October 15: The Q4 2026 Amazon Fee Math
Amazon's holiday peak fulfillment fees start October 15, 2026. Here is how they cut your break-even ACoS by roughly two points, and what to recalculate per SKU.
TL;DR: Amazon's holiday peak fulfillment fees run October 15, 2026 to January 14, 2027, adding about $0.32 per unit with a 3.5% surcharge on top. That lowers break-even ACoS by roughly 1.9 to 2.5 points on a typical FBA unit, just as Q4 CPCs climb. Recalculate per SKU before October 15, adjust targets only where you run near the ceiling, and set a reminder to revert on January 15.

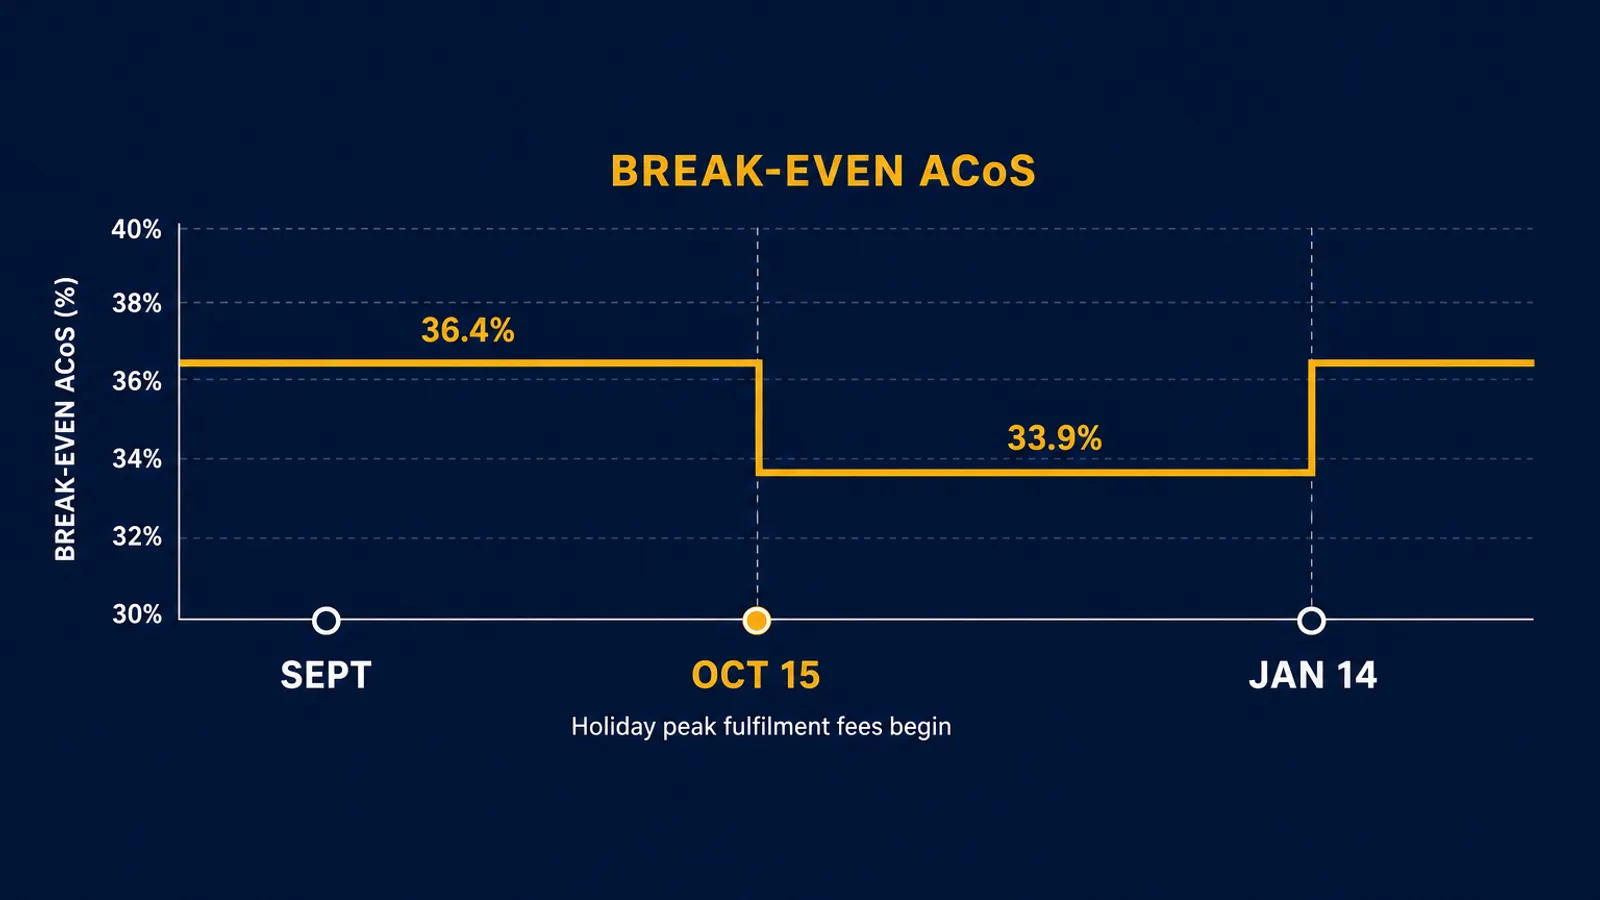
Amazon's holiday peak fulfillment fees start on October 15, 2026. Most sellers file that under operations, note the per-unit cost, and move on. It is also an advertising change, because break-even ACoS is a function of contribution margin, and peak fees take a bite out of contribution margin on every FBA unit you ship for three months.
The number is small. On a typical unit it moves break-even ACoS down by about two percentage points. Small enough that it is genuinely fine to ignore on most of your catalogue, and large enough to matter on exactly the SKUs you are about to push hardest. Knowing which is which is the whole job, and it takes about twenty minutes with a spreadsheet.
What actually changes on October 15
Amazon confirmed the 2026 holiday schedule in July. Peak fulfillment fees apply from October 15, 2026 through January 14, 2027 across FBA, Remote Fulfillment with FBA, Multi-Channel Fulfillment, and Buy with Prime. The increase averages $0.32 per unit over non-peak rates, the same per-unit step as the 2025 peak.
Two details matter more than the headline average.
First, the 3.5% fuel and logistics surcharge that Amazon introduced in April 2026 applies on top of the peak rate, not instead of it. It also has no announced end date. So the peak fulfillment cost you pay in November is the non-peak fee, plus the peak step, plus 3.5% of that total.
Second, the step is a flat dollar amount per size tier, not a percentage. Amazon's published examples show a small-standard mobile device case going from $2.49 to $2.68, a large-standard t-shirt from $6.14 to $6.53, and a small-bulky item from $10.21 to $11.25. A flat charge lands very differently on a $14.99 unit than on a $79.99 one, which is why an account-level adjustment is the wrong instrument here.
The inventory side has its own calendar. Amazon's recommended arrival deadlines run September 2 to 16 for Prime Big Deal Days and October 14 to 28 for Black Friday and Cyber Monday, depending on inbound method. If your Q4 units land after October 15, they ship at peak rates for their entire selling window.
Break-even ACoS is a margin equation, not a benchmark
Worth restating, because the two get conflated constantly. Break-even ACoS is not a number you look up. It is:
Break-even ACoS = contribution margin per unit ÷ sale price
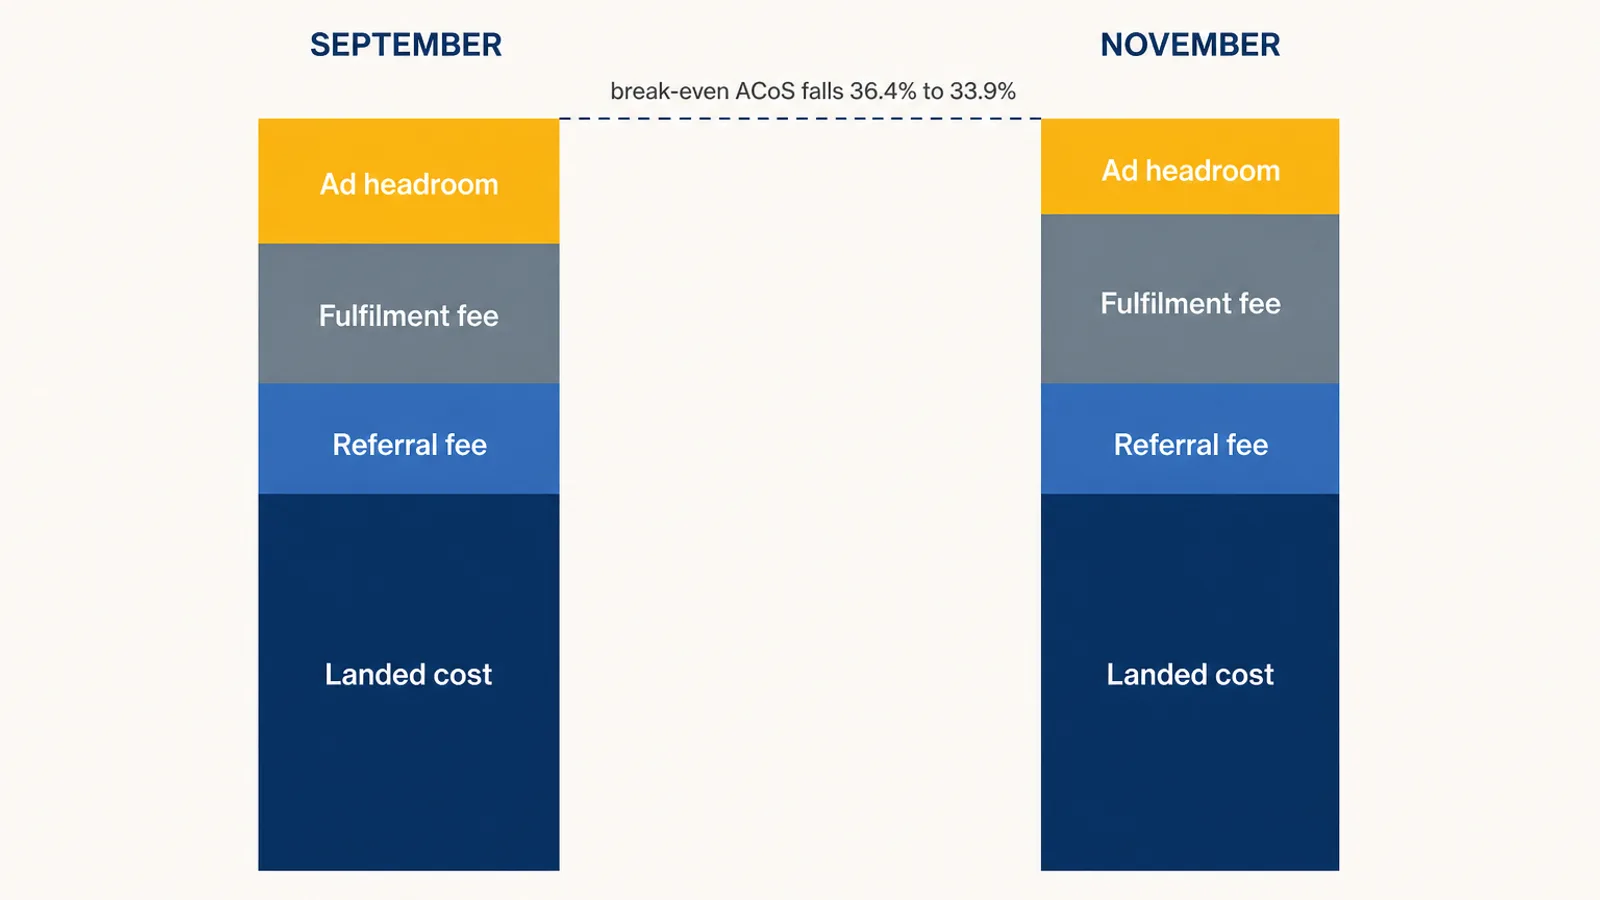
Where contribution margin is sale price minus referral fee, minus fulfillment fee, minus landed product cost. It is the ACoS at which an incremental advertised sale contributes exactly zero profit. Above it you are buying revenue with your own money. Below it, the gap between your actual ACoS and break-even is your margin on that sale.
Target ACoS is a different thing: the number you actually manage bids toward, set below break-even by however much profit you want to keep. Fee changes move the ceiling. They do not automatically move your target, and treating them as the same number is where most of the bad Q4 decisions start.
Running the numbers on three SKU shapes
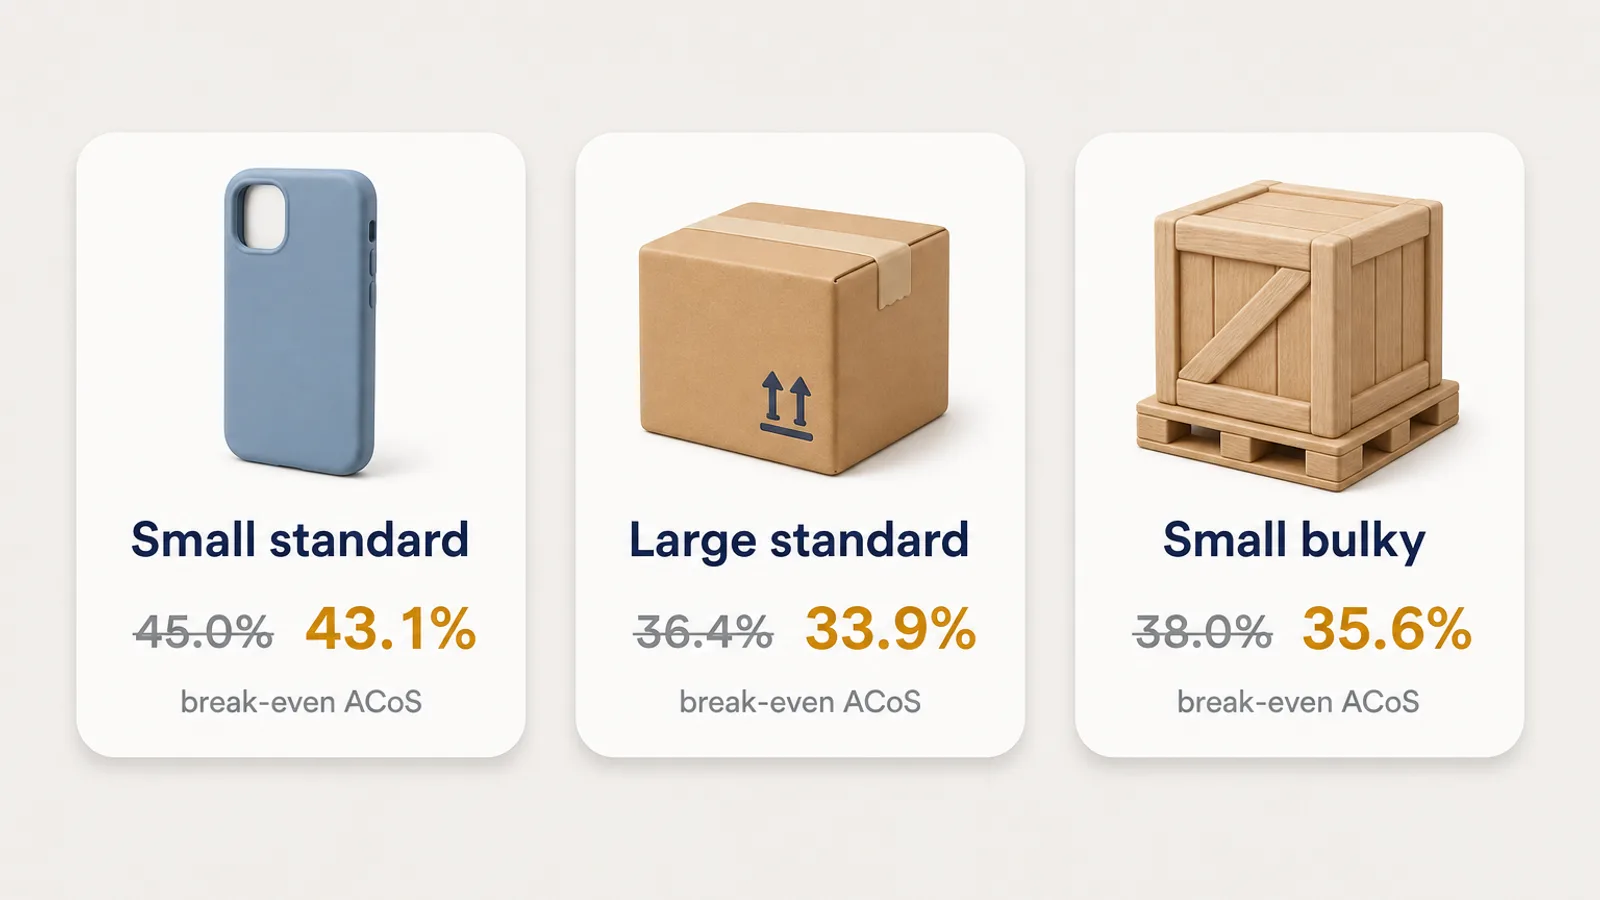
Using Amazon's own published fee examples, a 15% referral fee, and the 3.5% surcharge applied to the peak fulfillment rate:
| SKU | Price | Landed cost | Break-even ACoS (non-peak) | Break-even ACoS (peak) | Change |
|---|---|---|---|---|---|
| Small standard phone case | $14.99 | $3.50 | 45.0% | 43.1% | -1.9 pts |
| Large standard home goods | $24.99 | $6.00 | 36.4% | 33.9% | -2.5 pts |
| Small bulky | $59.99 | $18.00 | 38.0% | 35.6% | -2.4 pts |
Take the middle row in full. At $24.99, the referral fee is $3.75 and landed cost is $6.00. Non-peak fulfillment is $6.14, leaving $9.10 of contribution, or 36.4% break-even ACoS. From October 15, fulfillment is $6.53 plus the 3.5% surcharge, so $6.76. Contribution falls to $8.48 and break-even lands at 33.9%.
Two and a half points. If you have been running that SKU at a 24% target, nothing about your Q4 changes and you should not touch it. If you have been running it at 34% to hold rank on a competitive term, you crossed from thin profit into a loss on October 15 without changing a single bid.
That is the practical shape of this: it is not a catalogue-wide problem, it is a problem on the specific SKUs where target ACoS already sits within a few points of break-even. In most accounts that is a short list, and it correlates almost perfectly with the Q4 push list, because pushing for rank and velocity is exactly what compresses the gap in the first place.
Why the timing collides with rising CPCs
October 15 is not a neutral date. It is roughly when Q4 auction pressure starts building, so the ceiling comes down in the same weeks the cost of a click goes up.
The recent read on that is worth being precise about. During Prime Day 2026, year over year CPC was almost flat, down 0.7%, but it ran 37.3% above the 14-day pre-event daily baseline. Event premiums are measured against your own recent baseline, not against last year's event. Against a cross-category average CPC of about $1.13, a Q4 premium of that order is real money on any SKU with thin contribution.
There is a genuine counterweight, and it points the other way. As we covered in our Q4 2026 traffic analysis, Prime Day 2026 saw unit conversion rise 17.1% to a 20.0% blended rate while traffic fell. A higher conversion rate means each click is worth more, which supports a higher bid at the same ACoS target.
So you have two forces working in opposite directions. Conversion strength argues for bidding up. Peak fees lower the ceiling you are bidding under. Neither one justifies a blanket move in either direction, and averaging them into a single account-level adjustment produces a number that is wrong for every SKU individually. The answer is per-SKU math, which is tedious and is also the entire point.
What to do before October 15
Recalculate break-even per SKU, not per account. Pull sale price, referral fee percentage, current fulfillment fee, and landed cost for every SKU you plan to advertise through Q4. Add the peak step for its size tier, apply 3.5%, and recompute. Our break-even ACoS calculator does the arithmetic if you would rather not build the spreadsheet.
Sort by headroom, not by spend. Rank SKUs by the gap between current target ACoS and the new peak break-even. Anything with less than about five points of headroom is on the list. Everything else is noise and should be left alone.
Adjust only the short list. For SKUs on it, decide deliberately: pull the target down to restore margin, or hold it and accept that you are buying rank at cost for a defined window. Both are legitimate. Doing it by accident is not.
Check your landed cost inputs are current. This is the step people skip, and it makes the rest worthless. If your cost figures still reflect last year's freight or a pre-tariff supplier price, your break-even was already wrong before Amazon changed anything.
Do not cut spend across the board. With traffic as the scarce input this quarter, a reflexive budget cut buys you margin on a smaller base at the exact moment reach is hardest to buy. Fix the specific SKUs where the math actually broke.
The part most sellers get wrong: January 15
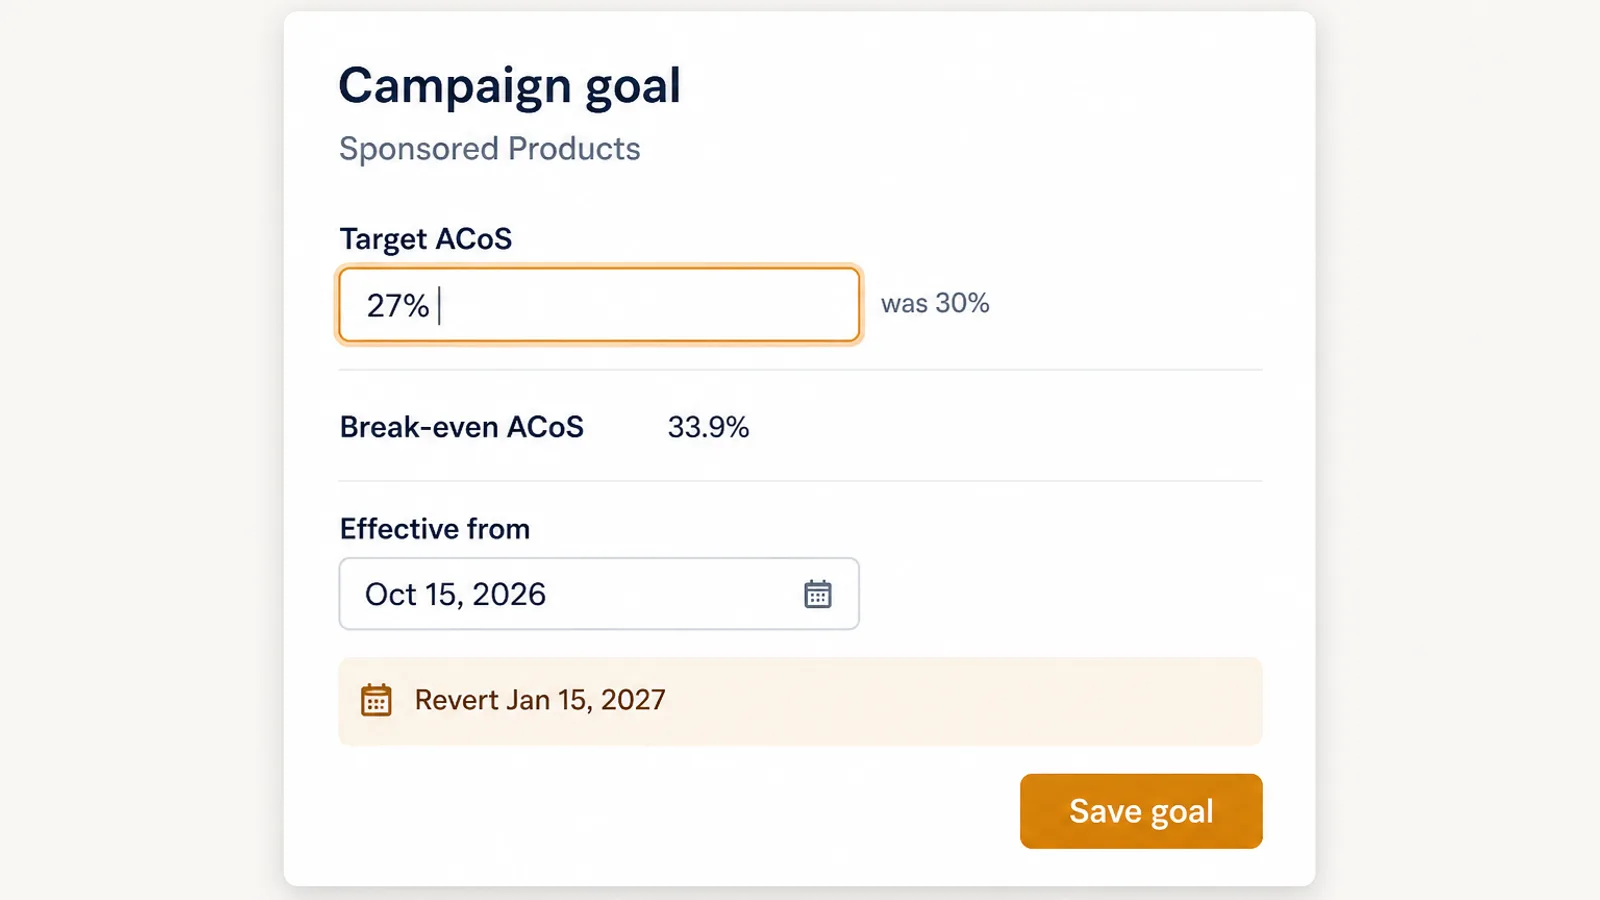
Peak fees end on January 14, 2027. Non-peak rates resume the next day, and break-even ACoS goes back up by the same two points it came down.
Almost nobody reverts. The targets set in October quietly persist into February, March, and often the following summer, and the account runs structurally under-bid against a ceiling that moved back up months earlier. It does not look like a problem in any report, because a slightly-too-low target does not produce an alert. It produces impressions you never bought and rank you slowly give away, and it is one of the more common reasons Q1 performance looks softer than it should.
If you make one change from this post, make it the calendar entry: January 15, 2027, revert Q4 ACoS targets. Put it in the shared calendar, not your own head.
Where automation actually helps here
The arithmetic above is not hard. Keeping it current across a few hundred SKUs, twice a year, on a deadline, in the busiest quarter, is.
This is the specific gap Autron is built around. You set goals as ACoS or TACoS targets and provide product cost inputs, and the bid engine works backwards from those to per-target bids, re-optimising on a roughly three-hour cadence rather than whenever someone next opens a bulk sheet. When a cost input changes, the implied bids follow through the whole account on the next cycle instead of waiting on a manual edit. It also reads sales and traffic, inventory state, and search-term history alongside the ad data, so a Q4 target change is evaluated against what the SKU is actually doing rather than against ad metrics in isolation.
The judgment calls stay yours. Which SKUs to defend, what margin to hold, when to buy rank at cost. Those are strategy, and they should be. Propagating a target change correctly across a catalogue at 6am on October 15 is not strategy, and there is no reason to spend your Q4 doing it by hand.
FAQ
When do Amazon's 2026 holiday peak fulfillment fees start? They apply from October 15, 2026 through January 14, 2027, covering FBA, Remote Fulfillment with FBA, Multi-Channel Fulfillment, and Buy with Prime. Non-peak rates resume January 15, 2027.
How much do the 2026 peak fees add per unit? An average of $0.32 per unit over non-peak rates, the same increase as the 2025 peak season. The exact amount varies by size tier, and the 3.5% fuel and logistics surcharge applies on top of the peak rate.
How much does that change my break-even ACoS? On typical FBA units it moves break-even ACoS down by roughly 1.9 to 2.5 percentage points. A $24.99 large-standard unit at $6.00 landed cost goes from about 36.4% break-even to about 33.9%.
Should I lower my target ACoS for Q4 2026? Only where your target already sits close to break-even. Most SKUs run targets well under the ceiling, so a two-point ceiling move changes nothing. The SKUs that need attention are the ones you deliberately push near break-even for rank and velocity, which in Q4 is usually the Black Friday and Cyber Monday push list.
What is the difference between break-even ACoS and target ACoS? Break-even ACoS is the ceiling, the ACoS at which an incremental advertised sale contributes exactly zero profit. Target ACoS is the number you actually manage bids toward, set below the ceiling by however much margin you want to keep. Fee changes move the ceiling; they do not automatically move the target.
Get your Q4 numbers straight
Run your own SKUs through the break-even ACoS calculator and the PPC profit calculator before October 15, so you know which ones actually need a target change.
If you would rather the targets propagate themselves, sign up for Autron Pro. Set the goal and the cost inputs once, and the bid engine keeps every campaign aligned to them through peak and back out again.