
ACoS vs TACoS on Amazon: What Each Metric Tells You and Which to Trust in Q4
ACoS vs TACoS on Amazon: what each metric measures, how to read the two together, what a good TACoS is, and which one to trust when Q4 pushes ad spend up.
TL;DR: ACoS is ad spend divided by ad-attributed sales, so it grades your ads in isolation. TACoS is ad spend divided by total sales, paid plus organic, so it grades what advertising costs the whole business. Use ACoS to tune bids and targets, use TACoS to set budgets and judge growth, and always read them together: the direction each one moves tells you more than either number alone.

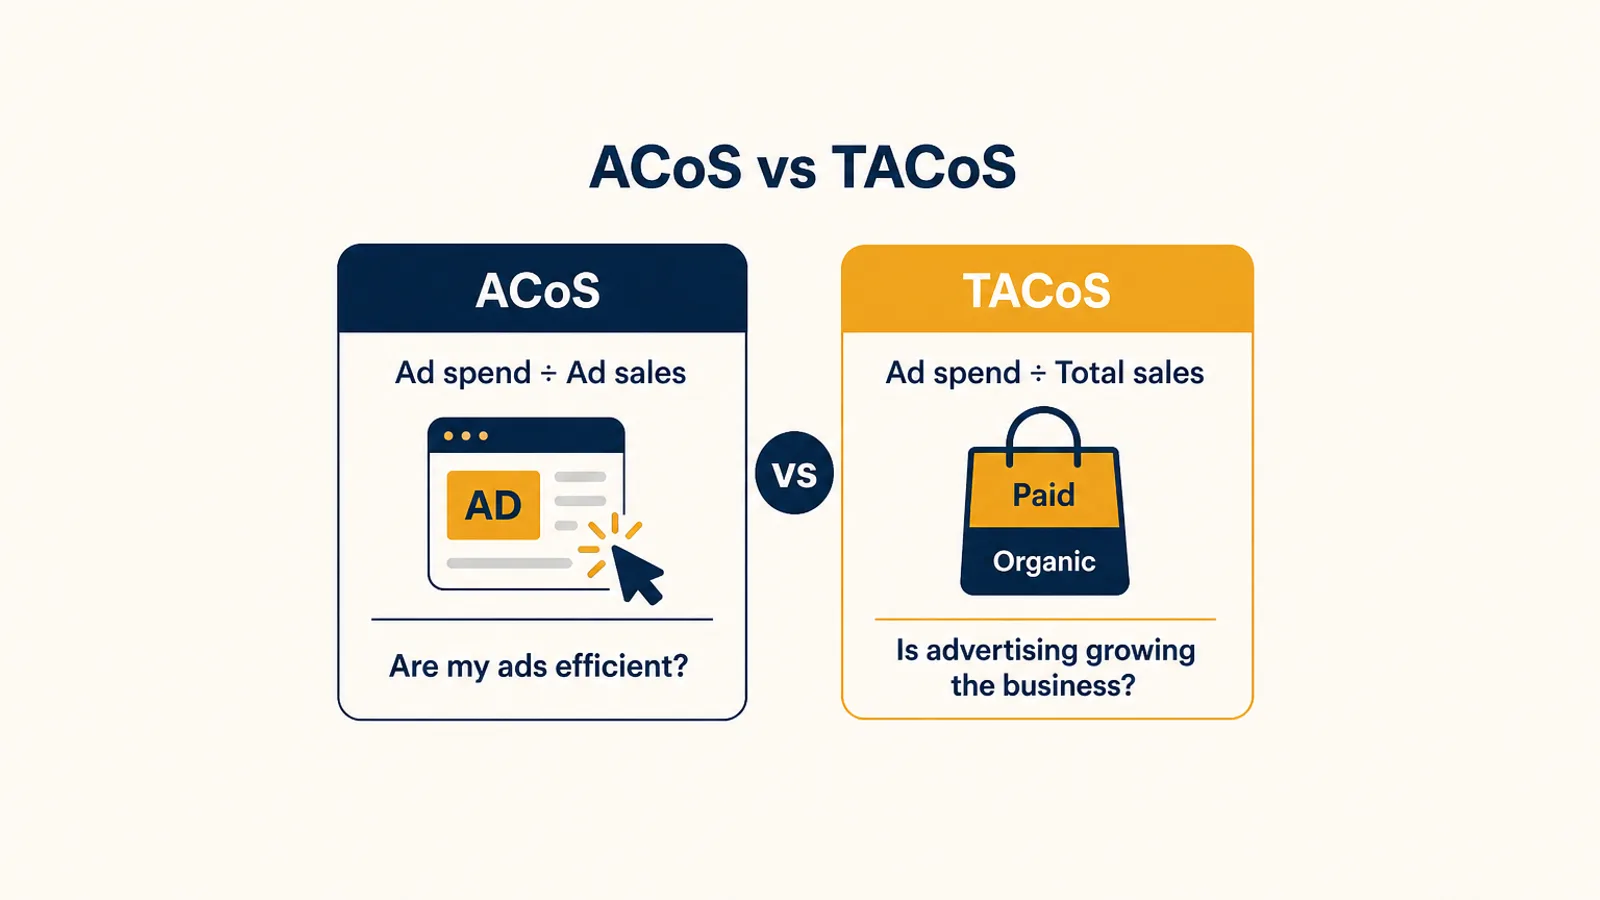
If you sell on Amazon, you have two numbers that sound almost identical and answer completely different questions. ACoS vs TACoS is the difference between "are my ads efficient?" and "is advertising actually growing my business?" Most sellers watch the first one daily and check the second one rarely, which is backwards for the next three months.
This week is a good example of why. Prime Big Deal Days runs October 6-7, CPCs rise, deal prices squeeze margins, and campaign ACoS will look worse in plenty of accounts that are having a great event. Amazon's own advice for exactly this moment: "When ACOS rises during high-traffic events, we don't immediately pull back. Instead, we look at TACOS, and often, we find it dropping" (Amazon Ads).
Here is what each metric measures, how to read them together, and which one should drive which decision.
What ACoS measures
ACoS, advertising cost of sale, is ad spend divided by the sales those ads are credited with. Amazon defines it as ad spend divided by ad revenue, times 100, with a simple example: spend $50, earn $100 in attributed sales, and your ACoS is 50%.
ACoS = ad spend ÷ ad-attributed sales × 100
Two details matter more than the formula.
First, "attributed" means Amazon decides which sales count. A sale is credited to an ad only if it happens within the attribution window after a click, which is shorter for Sponsored Products on Seller Central than for Sponsored Brands. Sales that happen outside that window, or that the shopper would have made through your organic listing anyway, are invisible to ACoS in opposite directions.
Second, ACoS has a hard ceiling that is specific to each product. Amazon puts it plainly: to stay profitable, your ACoS needs to be lower than your profit margin. That ceiling is your break-even ACoS, and it moves whenever your price or fees move. Our break-even ACoS calculator works it out per SKU, and the Q4 peak fees post shows how much it shifts on October 15.
So ACoS is a precise, granular efficiency metric. It can tell you that one keyword converts at 18% and another at 60%. What it cannot tell you is whether any of those sales were new.
What TACoS means on Amazon
TACoS, total advertising cost of sale, keeps the same numerator and swaps the denominator for every sale the product made, paid and organic together.
TACoS = ad spend ÷ total sales × 100
If you spent $6,000 on ads in September and the products sold $60,000 in total, your TACoS is 10%. One dollar of every ten in revenue went back into advertising. Amazon describes it as the metric that reveals whether your total sales, organic and paid, are growing in relation to your ad spend.
To calculate it yourself, you need two numbers from two places, for the same products and the same dates:
- Ad spend from Campaign Manager, summed across Sponsored Products, Sponsored Brands and Sponsored Display. Leaving out Sponsored Brands or Display understates TACoS, sometimes by a lot.
- Total sales from the Sales and Traffic business report in Seller Central (ordered product sales), not from the advertising console, which only knows about attributed sales.
There is also a useful identity that links the two metrics:
TACoS = ACoS × (ad sales ÷ total sales)
With a 25% ACoS and ads producing 40% of revenue, TACoS is 25% × 0.4 = 10%. That makes it obvious why TACoS can move while ACoS stays perfectly still: the share of sales that come through ads is the second lever, and it is the one that tells you about organic health.
ACoS vs TACoS side by side
| ACoS | TACoS | |
|---|---|---|
| Formula | Ad spend ÷ ad-attributed sales | Ad spend ÷ total sales (paid + organic) |
| Question it answers | Are these ads efficient? | What does advertising cost the business? |
| Best level | Keyword, target, ad group, campaign | Product, brand, account |
| Data source | Advertising console only | Advertising console plus Seller Central sales |
| Blind spot | Ignores organic sales, including ones ads displace or create | Can't tell you which campaign is the problem |
| Ceiling | Break-even ACoS (your margin before ads) | Your overall marketing budget as a share of revenue |
| Typical range | Varies by margin and category | Roughly 8 to 40%, depending on product stage |
The short version: ACoS grades the ads, TACoS grades the advertising strategy.
Same ACoS, very different businesses
The clearest way to see why you need both is two accounts that report the same campaign ACoS.
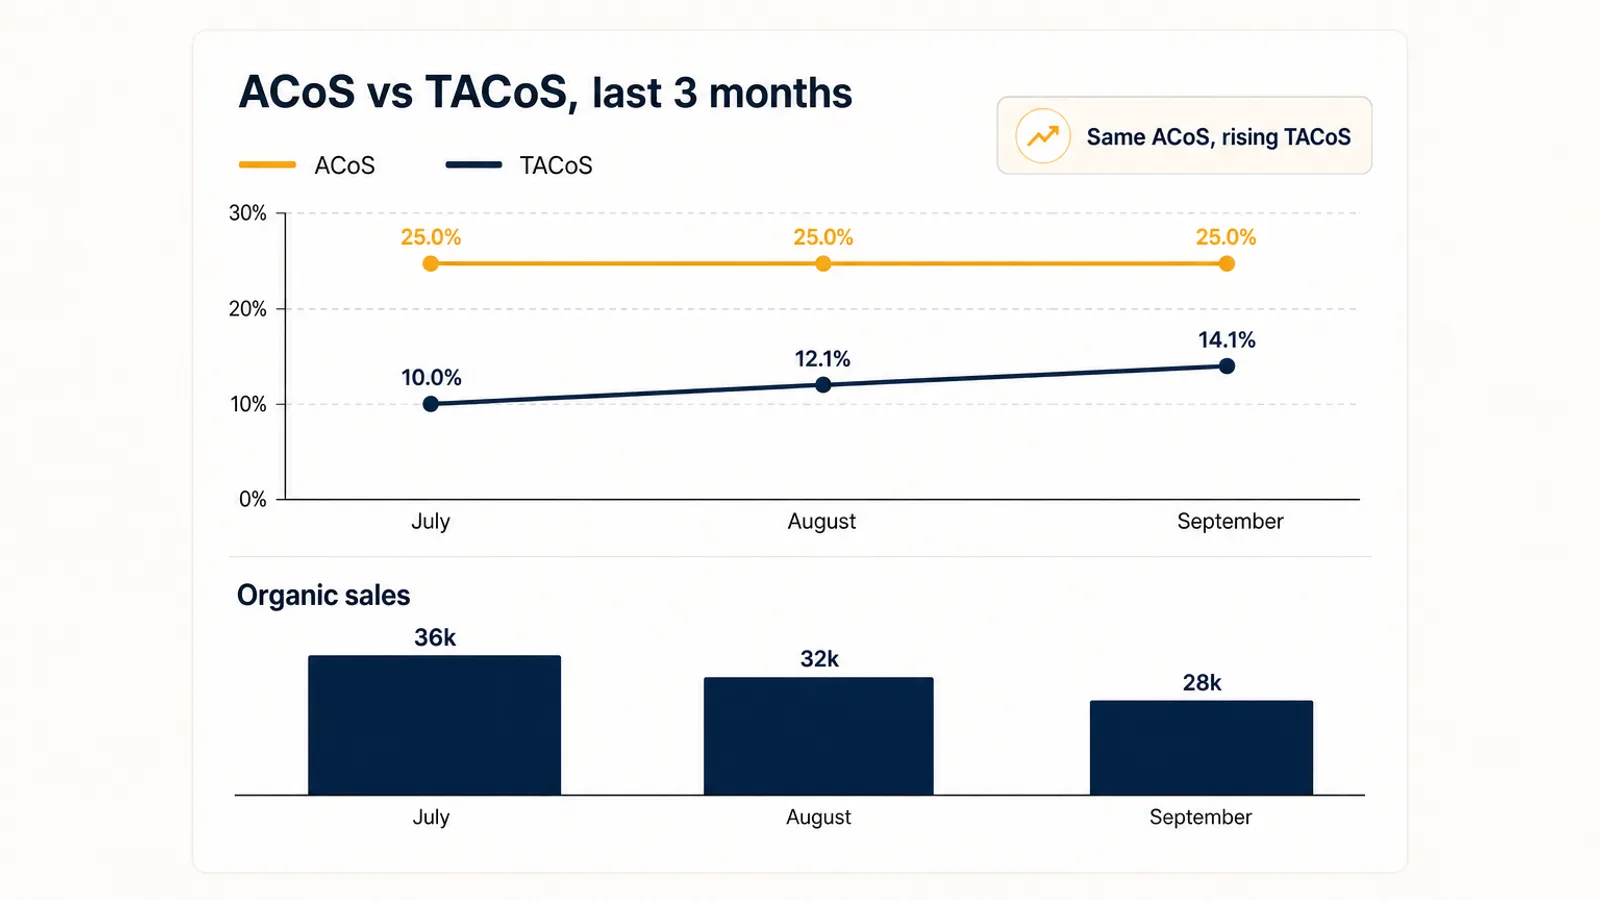
Account A scales spend for three months and holds a steady 25% ACoS. On the campaign dashboard, that looks like disciplined growth.
| Month | Ad spend | Ad sales | ACoS | Total sales | Organic sales | TACoS |
|---|---|---|---|---|---|---|
| July | $6,000 | $24,000 | 25.0% | $60,000 | $36,000 | 10.0% |
| August | $7,500 | $30,000 | 25.0% | $62,000 | $32,000 | 12.1% |
| September | $9,000 | $36,000 | 25.0% | $64,000 | $28,000 | 14.1% |
Ad sales grew by $12,000. Total sales grew by $4,000. Roughly two thirds of the "new" ad revenue was organic revenue that moved into a paid column. ACoS never flinched, because it can't see the organic side. TACoS climbed four points and told the real story: the account is paying for sales it used to get free. That is the pattern we unpack in the PPC cannibalization and TACoS guide.
Account B does the opposite. ACoS gets worse, and the business gets better.
| Month | Ad spend | Ad sales | ACoS | Total sales | Organic sales | TACoS |
|---|---|---|---|---|---|---|
| July | $6,000 | $24,000 | 25.0% | $60,000 | $36,000 | 10.0% |
| August | $8,000 | $26,000 | 30.8% | $72,000 | $46,000 | 11.1% |
| September | $8,000 | $25,000 | 32.0% | $84,000 | $59,000 | 9.5% |
A seller managing on ACoS alone would cut bids in August. A seller reading TACoS would see that the extra spend pushed the product up the organic rankings, and organic sales grew by $23,000 on $2,000 a month of extra advertising.
How to read ACoS and TACoS together
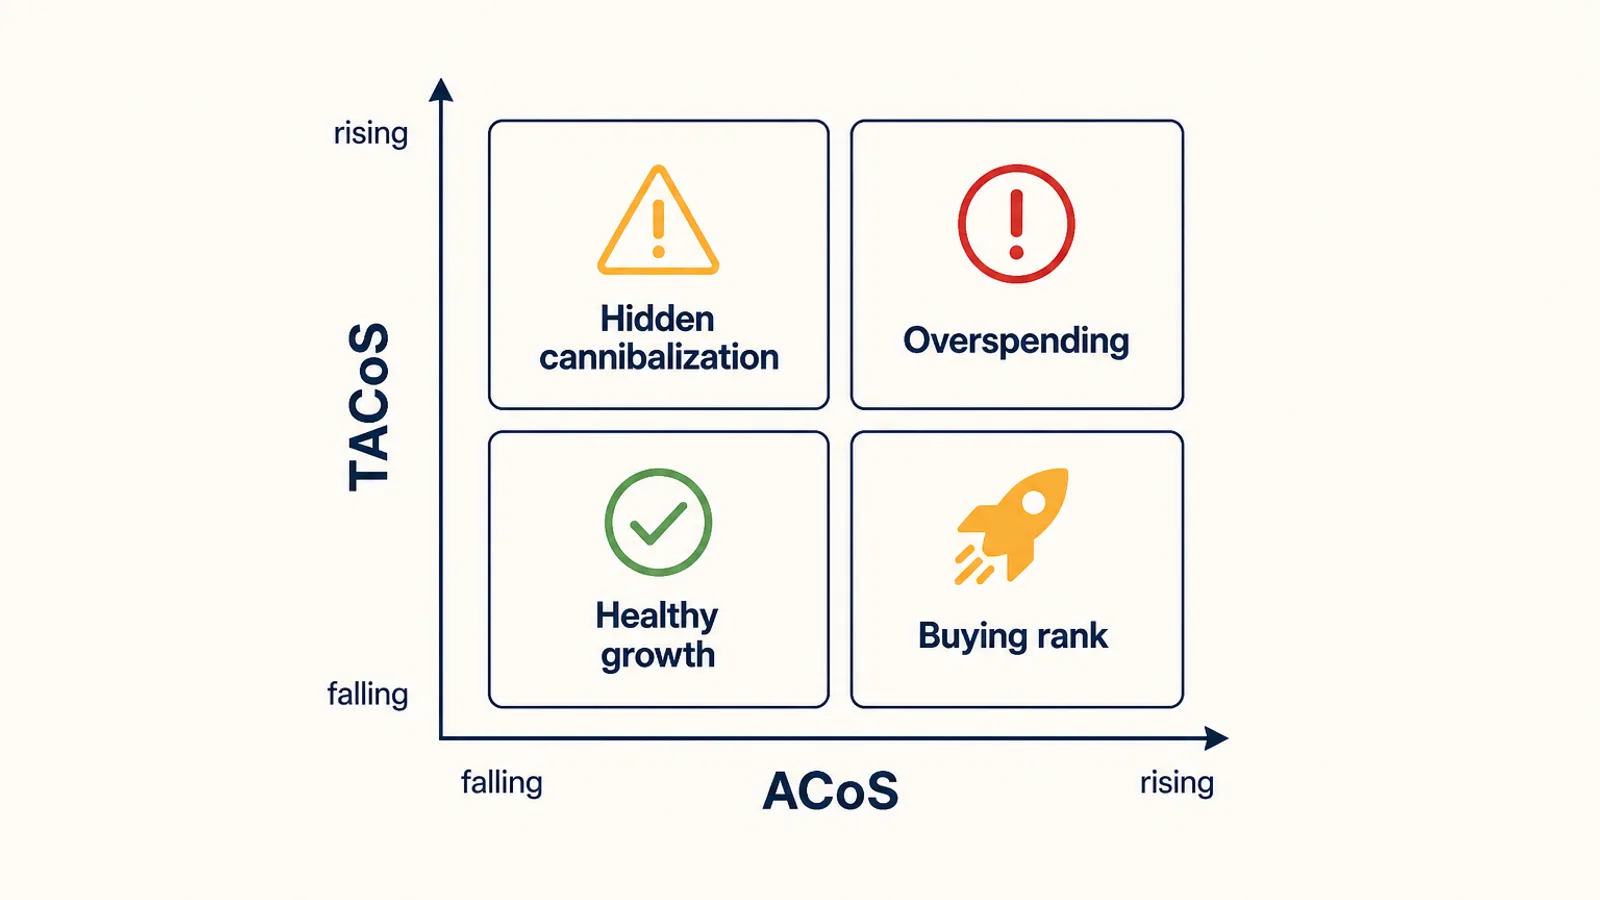
Because the two metrics move semi-independently, the useful read is the direction of each over the same window, ideally four weeks or more so attribution lag and one-off days wash out. There are four combinations.
ACoS down, TACoS down. Ads are getting more efficient and organic sales are holding or growing. Healthy. Keep doing what you are doing and look for room to scale.
ACoS up, TACoS down. Ads cost more per attributed sale, but total sales are growing faster than spend. This is the launch pattern and the deal-event pattern, and it is usually fine if it is deliberate. Check that it is producing organic rank, not just a temporary spike.
ACoS down, TACoS up. The one that hides best. Either ads are harvesting sales your organic listing would have won (cannibalization), or organic sales are falling for a reason that has nothing to do with ads: a stockout, a lost Buy Box, a price change, a rival taking your organic slot. Diagnose before you touch bids.
ACoS up, TACoS up. You are spending more for less, at both levels. Compare ACoS to break-even on your biggest campaigns first, then look at which products are carrying the TACoS increase.
What is a good TACoS on Amazon?
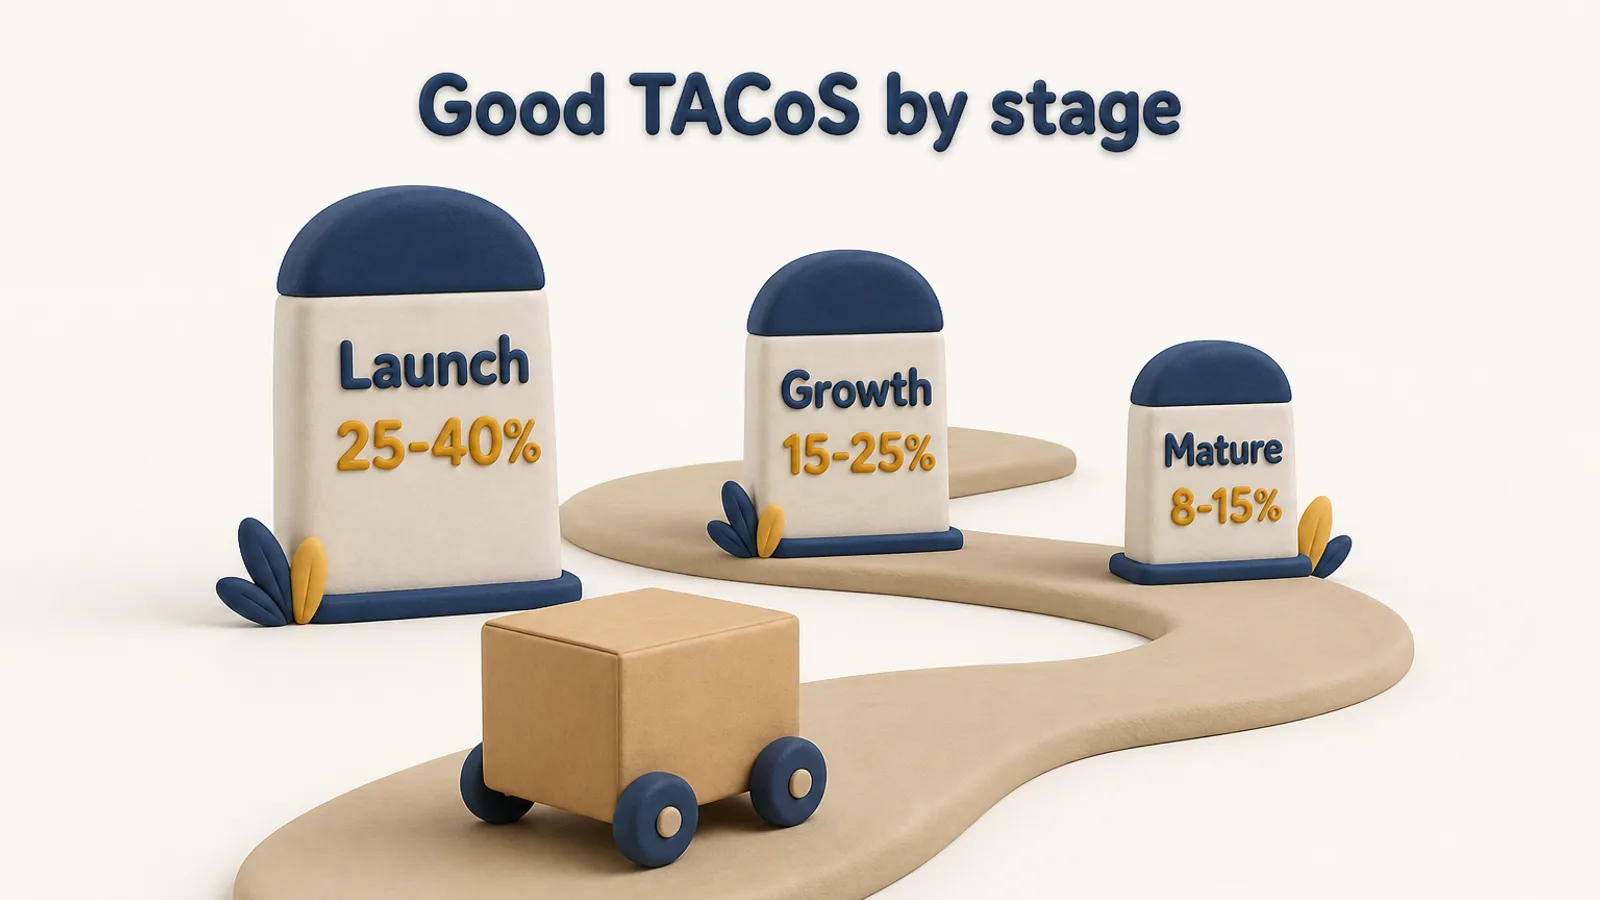
There is no single good number, for the same reason Amazon says there isn't a definitive number for a good ACoS: margin, category and stage all change it. The ranges we use as a starting point, and explain in more depth in the TACoS guide, follow the product's life cycle:
- Launch, roughly 25 to 40%. You are paying to create sales velocity and reviews before there is organic rank to lean on. A high TACoS here is the investment, not a mistake.
- Growth, roughly 15 to 25%. Organic rank is building. TACoS should be trending down month over month even while spend rises.
- Mature, roughly 8 to 15%. Strong organic position, with ads defending it and picking up incremental demand. A rising TACoS on a mature product is the earliest warning you will get.
Two sanity checks keep these ranges honest. TACoS has to fit inside your overall margin with room for profit, so a 15% TACoS on a product with a 20% margin before ads leaves very little. And the trend beats the snapshot every time: a mature product moving from 9% to 13% over a quarter needs attention even though 13% sits inside the range.
Which metric should drive which decision
Use each metric where its blind spot doesn't matter.
Let ACoS drive keyword and target bids, search-term harvesting, negative keywords and placement adjustments. These are decisions about individual clicks, and ACoS is the only one of the two that is attributed at that level.
Let TACoS drive total budget, product-level goals, launch exit criteria and the question of whether to defend branded or high-ranking terms. These are decisions about the business, and TACoS is the only one of the two that sees organic sales.
A few situations make TACoS misleading if you read it naively:
- Stockouts and Buy Box loss drop total sales and spike TACoS without any change in ad performance.
- Price changes and deals move total revenue independently of ads. A deal week can lower TACoS on volume even while margin falls.
- Off-Amazon traffic from email, social or influencers lifts organic sales and flatters TACoS. That is real revenue, but it is not proof your Amazon ads got better.
- Mixed catalogues. Account-level TACoS averages a launch at 35% with mature products at 9%. Read it by product or parent ASIN before drawing conclusions.
Reading Q4 through both metrics
The next three months are when the gap between the two numbers is widest.
During Prime Big Deal Days and again through Black Friday and Cyber Monday, expect ACoS to rise on many campaigns as CPCs climb and deal prices lower your break-even. That alone is not a reason to cut. Amazon notes that ACOS only measures the efficiency of ad-attributed sales, not the full picture. Judge the event on TACoS and total sales across a window that includes the days after it, because deal demand is partly pulled forward and the post-event trough is part of the cost. Our Prime Big Deal Days strategy post covers that trough in detail.
At the same time, don't let TACoS become an excuse. If ACoS on a campaign is above break-even and TACoS isn't falling, the event isn't buying you anything you can measure.
How Autron uses both
Autron is built around the idea that the goal belongs at the product level and the bid belongs at the target level. In Autron Pro, you set a goal per product, either a target ACoS or a maximum TACoS, alongside your product cost and margin, and the engine re-optimizes keyword and target bids across your campaigns on a roughly three-hour cycle to hold that goal, with placement adjustments and negative-keyword harvesting running alongside.
Because Autron syncs Amazon's sales and traffic data next to your advertising data, the TACoS it works to uses real total sales rather than an estimate. Autron Agent puts the same data behind a conversation, so "why did TACoS rise on these four ASINs last month?" gets an answer that separates ad efficiency from organic movement, instead of another export to reconcile.
FAQ
What is the difference between ACoS and TACoS? Both use the same numerator, your ad spend. ACoS divides it by ad-attributed sales, so it measures how efficiently your ads convert. TACoS divides it by total sales, ads plus organic, so it measures how much of your whole Amazon business is being bought with advertising.
What does TACoS mean on Amazon? TACoS stands for Total Advertising Cost of Sale. It is total ad spend across Sponsored Products, Sponsored Brands and Sponsored Display divided by total sales for the same products and period, shown as a percentage. A 10% TACoS means one dollar in every ten of revenue went back into ads.
What is a good TACoS on Amazon? It depends on the product's stage. A launch commonly runs 25 to 40% on purpose to buy rank, a growing product 15 to 25%, and a mature product with solid organic rank 8 to 15%. The trend matters more than the snapshot: a flat or falling TACoS while revenue grows is the healthy pattern.
Can ACoS go up while TACoS goes down? Yes, and it is often a good sign. It usually means ads are lifting organic rank and sales faster than they are costing you, which is common during launches and deal events. Amazon's own guidance says that when ACoS rises during high-traffic events, look at TACoS before pulling back.
Should I optimize for ACoS or TACoS? Both, at different levels. ACoS is the right control for keyword and target bids, because it ties spend to the sales those clicks produced. TACoS is the right control for budgets and product-level goals, because it tells you whether advertising is growing the business or just paying for sales you would have made anyway.
Check both numbers before Q4 locks in
Pull ACoS and TACoS for your top products over the last 90 days and put them side by side. If any product shows a steady ACoS and a rising TACoS, that is where to look first.
If you would rather have that done for you, the free Amazon PPC audit reads your campaigns against your sales data and shows where ad spend is growing the business and where it is just moving sales between columns. And if you want to ask your own data the follow-up questions, Autron Agent starts free and runs from $50/mo.