
How to Read the Amazon Search Query Performance Dashboard
How to read the Amazon Search Query Performance dashboard column by column, spot where your search funnel leaks, and turn SQP share metrics into PPC decisions.
TL;DR: Read the Search Query Performance dashboard as a funnel. Each query row shows impressions, clicks, cart adds, and purchases, plus your brand's share of each. Watch whether your share grows at every stage down the funnel. Wherever it drops instead of rising, that stage is your leak: weak click share is a listing problem, weak purchase share is a price or detail-page problem.

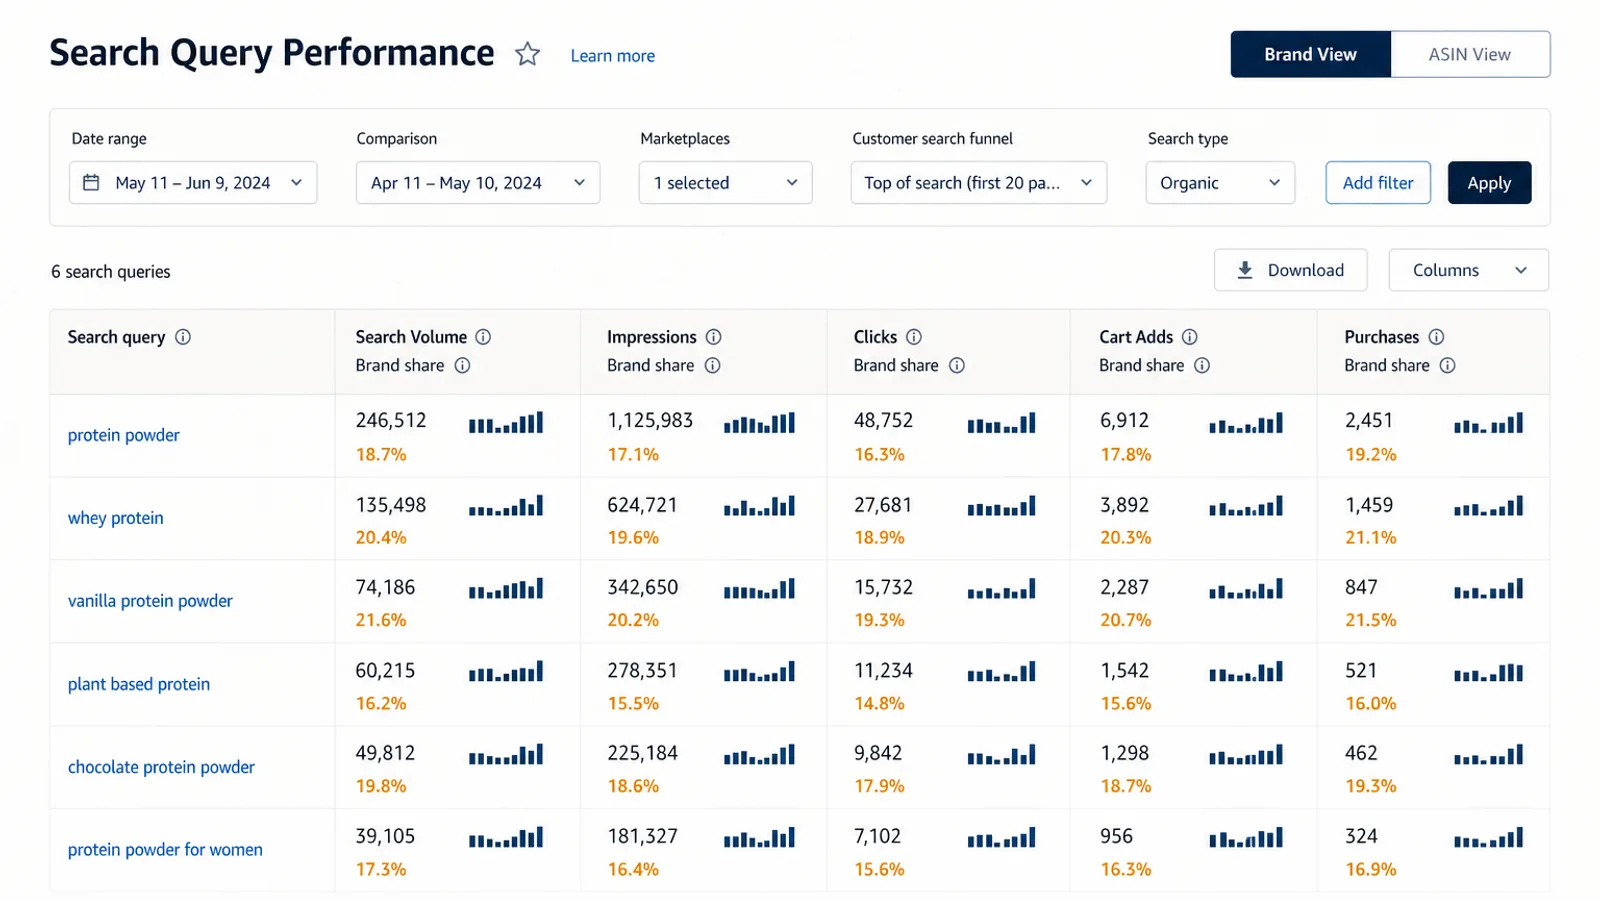
The Amazon Search Query Performance dashboard hands you first-party funnel data most sellers never fully read. They open it, see a wall of numbers, export a CSV, and move on. That is a waste, because knowing how to read the Search Query Performance dashboard tells you exactly where each search term loses you shoppers: at the impression, the click, the cart add, or the purchase. This guide walks the dashboard column by column, gives you one rule that turns the numbers into a diagnosis, and shows how to act on what you find.
If you still need to find the report or enroll in Brand Registry, start with our Search Query Performance report guide and come back here for the reading part.
The one rule: your share should grow down the funnel
Every other technique here follows from a single idea. The Search Query Performance dashboard reports each query as a four-stage funnel, and for every stage it shows two things: the total for the whole Amazon marketplace, and your brand's share of that total. So you are not just reading your own numbers, you are reading them against everyone else who ranks for that term.
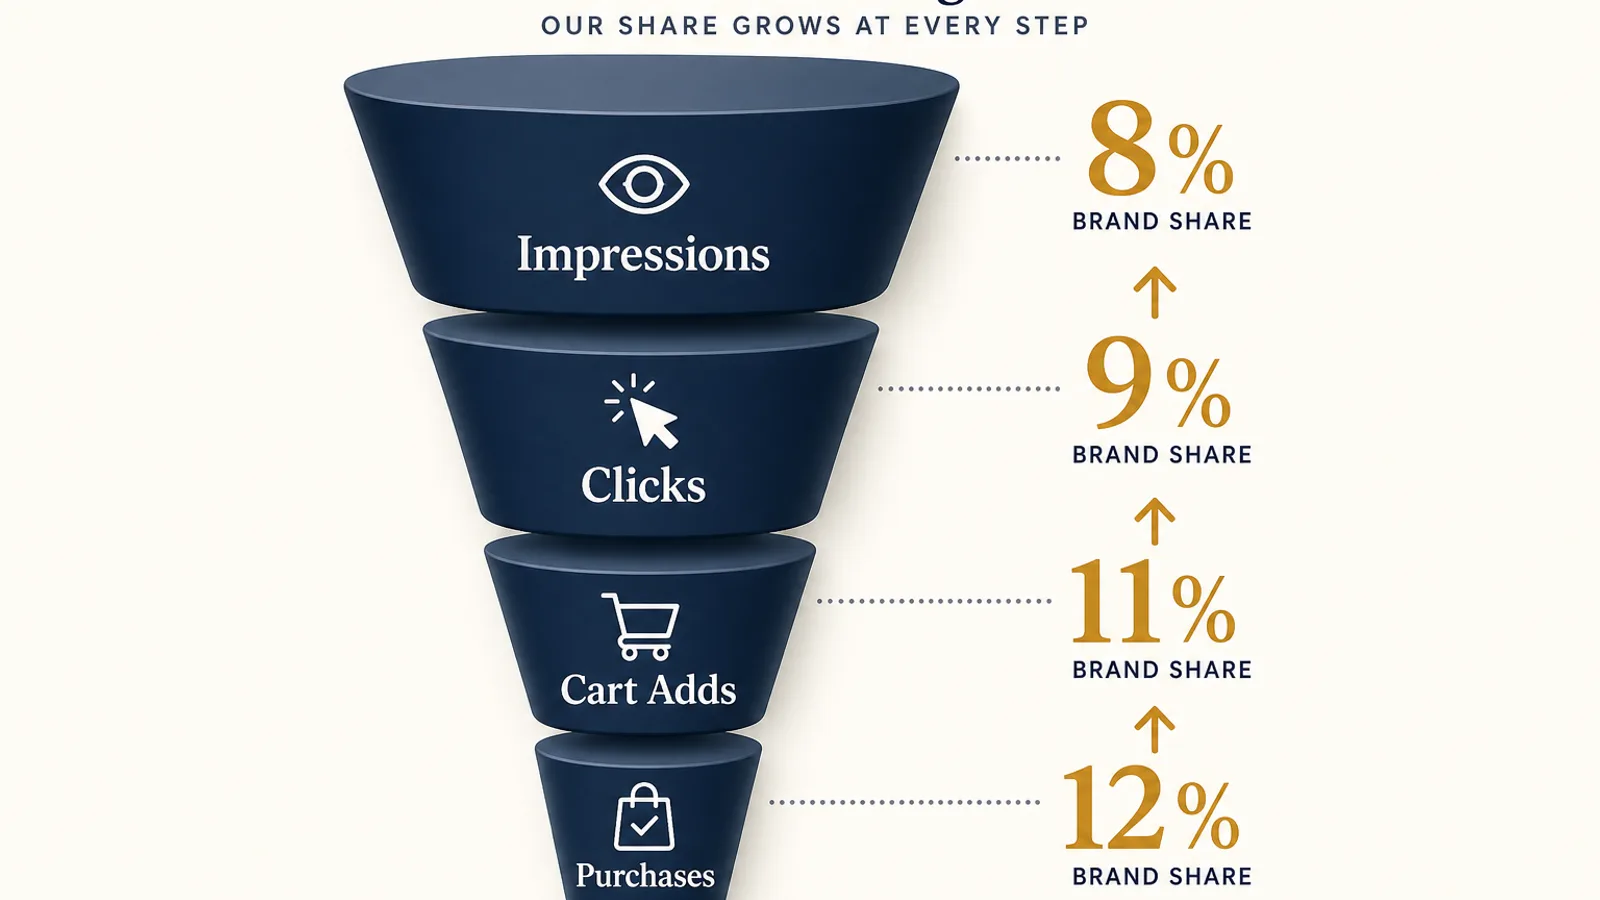
The rule: on a query you win, your share should rise at each step down the funnel. Something like 8% of impressions, then 9% of clicks, then 11% of cart adds, then 12% of purchases. Rising share means that once shoppers see and click your product, you convert them better than the average competitor on that term. That is the shape of a query you should be scaling.
When your share falls at a stage instead, that stage is your leak. The number does not have to hit zero to matter. If you hold 10% impression share but only 4% click share, you are losing the click, and no amount of extra ad spend fixes a listing that shoppers skip. Reading the dashboard well is mostly finding the first stage where share drops and asking why.
Reading the columns, left to right
Each row is one search query. The columns run in funnel order, and each stage has a market total and your share of it.
Search Query Volume. How many times shoppers typed this term in the period. This is your demand gauge and your sort key. Sort descending and the top of the list is where your attention pays off, because a two-point share gain on a high-volume term beats a perfect funnel on a term nobody searches.
Impressions. How often your products appeared for the query, organic and sponsored combined. Your impression share is a rank-and-reach number. Low impression share on a high-volume term means you barely show up: an organic ranking or ad-coverage gap, not a conversion problem.
Clicks. Clicks divided by impressions is your click-through rate, and click share versus impression share is the first real diagnosis. If click share trails impression share, shoppers see you and choose someone else. That is a search-results appeal problem: main image, title, price, star rating, or the lack of a badge. Note it and move to the next stage before deciding.
Cart Adds. The add-to-cart is the pre-purchase intent signal, a leading indicator of conversion that most tools never expose. If click share is healthy but cart-add share sags, the detail page is where interest dies: secondary images, A+ content, bullet clarity, or a price that reads fine in results but not on the page next to reviews.
Purchases. The bottom of the funnel, the number attributed to the query. If cart adds hold but purchase share drops, the doubt is late-stage: price at checkout, delivery speed, buy-box status, or review volume against the competitor who wins the sale.
Some views also show a Search Query Score or a conversion rate per query. Treat the score as a quick relevance flag, but trust the raw funnel counts and your share at each stage for decisions, because that is where the leak actually shows up.
Four patterns you will read again and again
Almost every query you inspect falls into one of four shapes. Learning to name them on sight is most of the skill.
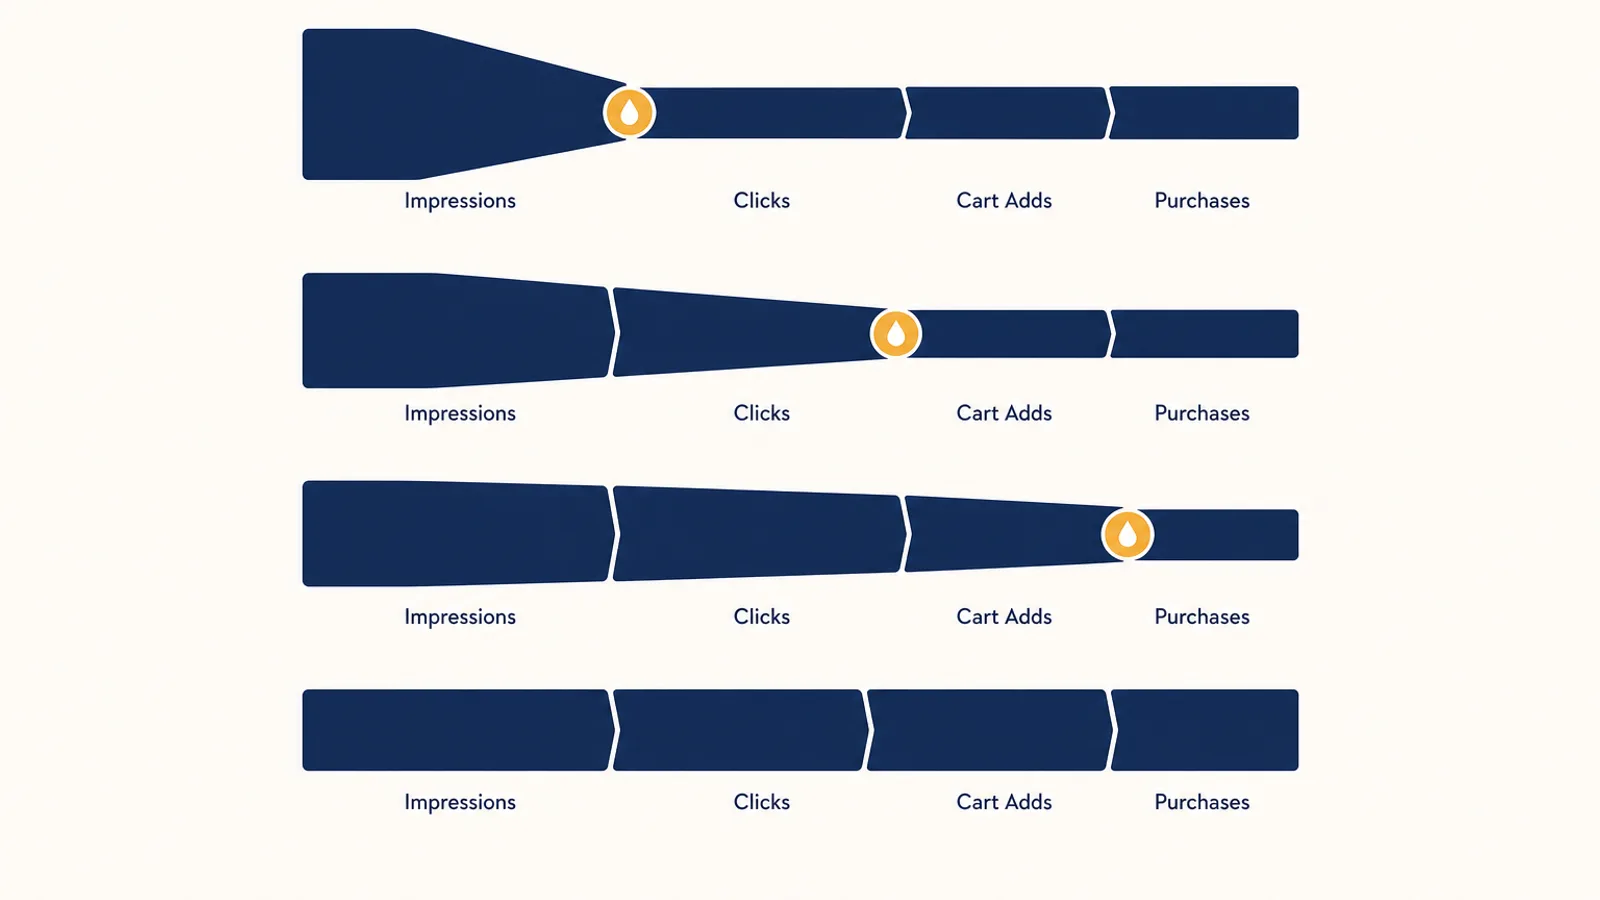
Low impression share. You hardly appear for a term with real volume. This is a visibility gap, not a conversion one. The fix is coverage: rank the keyword organically, add it to an exact-match campaign, or raise bids where the term already converts. This is exactly the harvesting signal Autron acts on automatically.
Impressions but weak click share. Shoppers see you and pass. Fix the listing at the search-results layer first, the main image, price, title, rating, before pouring more budget in. Spending more to be skipped more is the most common way sellers burn a good keyword.
Clicks but weak cart-add share. The click promised something the detail page did not deliver. Work the page: A+ content, secondary images, clearer bullets, honest pricing. The cart-add stage is the early warning most sellers miss because they only ever look at final conversion.
Strong all the way down. Rising share at every stage. Do not tinker, scale. Raise bids, widen match types, defend the term. These are the queries where more spend reliably returns more profit, and the SQP funnel is how you find them before your competitor does.
For the specific case where click share and conversion share diverge sharply, we go deeper in click share vs conversion share.
Brand View versus ASIN View: read the right one for the question
The dashboard toggles between two lenses, and reading the wrong one wastes time.
Brand View aggregates every product under your brand. Read it to answer "which queries matter to us, and is our share of them rising or falling over time." It is your radar: it surfaces the terms worth caring about and tracks share of voice week over week so you catch a competitor eating into a key query early.
ASIN View ties each query's funnel to a single product. Read it the moment you decide to fix something, because a detail-page or pricing change lands on one ASIN, not the brand. Brand View tells you a term is leaking at cart adds; ASIN View tells you which product's page to edit.
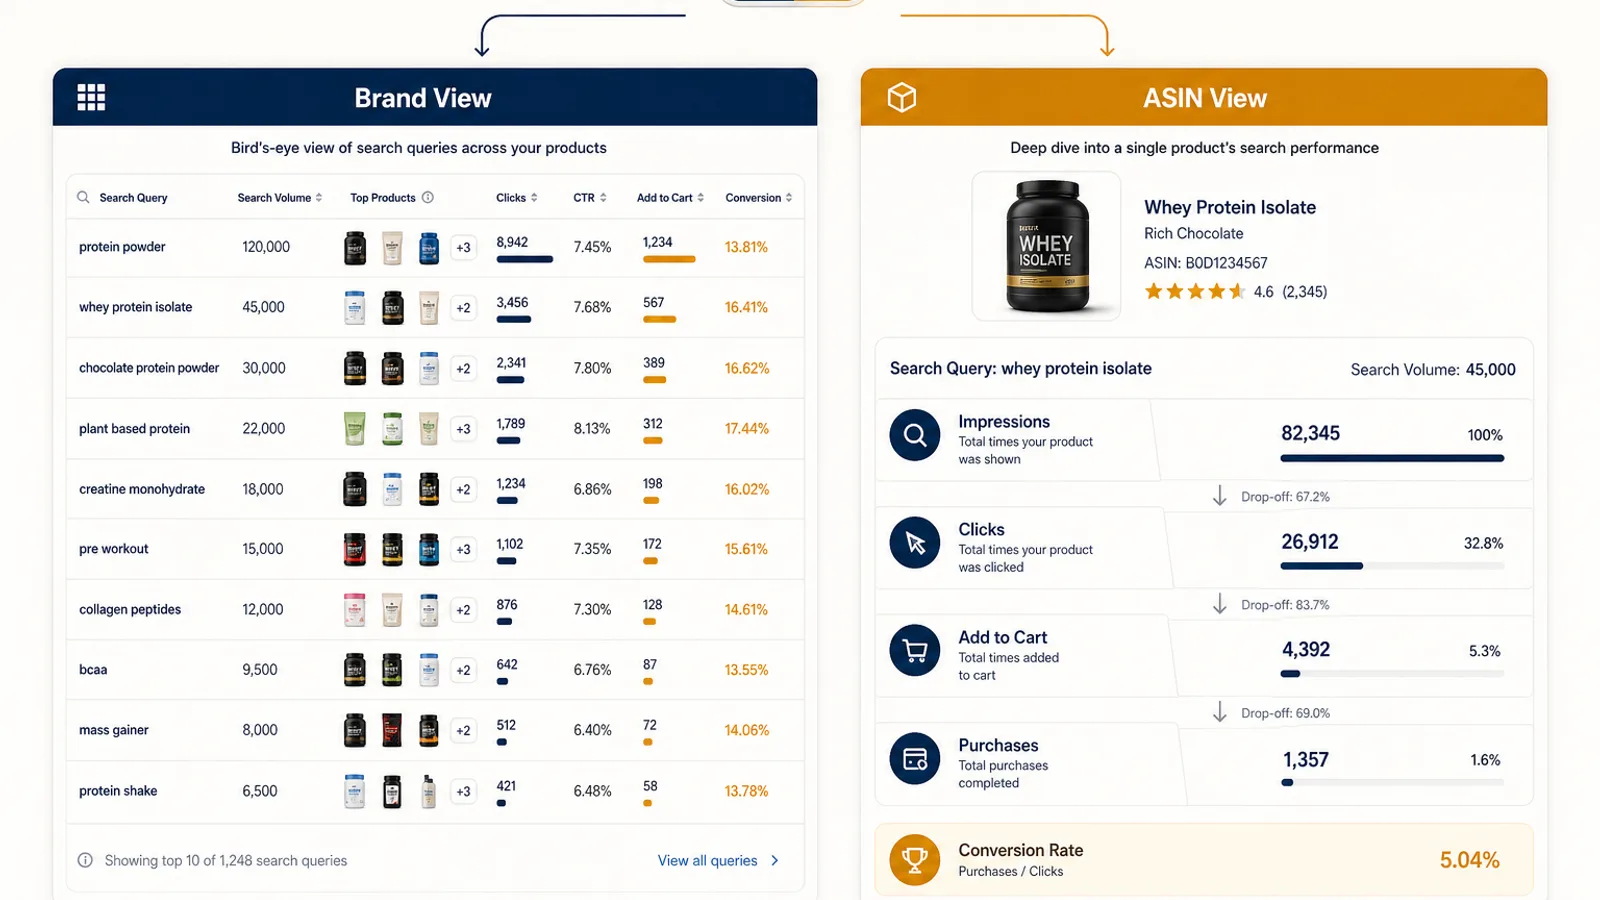
A practical loop: scan Brand View for the biggest share drops on high-volume terms, then jump to ASIN View for each to confirm which product and stage owns the problem. For the catalog-wide version of this, where the same funnel is read across every ASIN at once, see our Search Catalog Performance guide.
From reading to a weekly routine
Reading the dashboard once is interesting. Reading it on a schedule is what moves ACoS. Amazon refreshes Search Query Performance data weekly, so a light weekly pass plus a deeper monthly review is the right cadence.
Each week, sort your priority ASINs by search volume, walk the top terms, and mark the first stage where share drops. Batch the fixes by type: listing-image work for click-share leaks, detail-page work for cart-add leaks, bid and budget moves for the clean funnels worth scaling. Once a month, compare share of voice against prior weeks so slow erosion on a core term does not hide behind good weekly numbers.
The honest limit of the native dashboard is memory. It shows you a rolling window and makes you save CSVs by hand to see trends, which is why leaks that develop slowly get missed. Autron ingests your SQP and Search Catalog data automatically, keeps the full history, and lets you read the funnel with filters and trend charts instead of spreadsheets. Better, the Autron agent reads that same data on demand, so instead of scanning rows you can ask "which queries lost purchase share on my top ASINs this week and where is the funnel leaking," and get the diagnosis with the numbers behind it.
FAQ
How do you read the Search Query Performance dashboard? Read each query row left to right as a funnel: impressions, clicks, cart adds, purchases. For each stage Amazon gives you a total count and your brand's share of it. A healthy query is one where your share rises as you move down the funnel. The first stage where your share drops is the stage that needs work.
What does it mean when my click share is lower than my impression share? It means shoppers see your product for that query but pick a competitor instead. That is a listing-appeal problem at the search-results level: the main image, title, price, rating, or badge is losing the click. Fix the listing before you spend more on ads for that term.
What is a good funnel shape in the SQP report? A funnel where your share grows at each stage, for example 8% impression share, then 9% click share, then 11% cart-add share, then 12% purchase share. Rising share means you convert that query's traffic better than the average competitor ranking for it. Falling share flags the exact stage where you leak shoppers.
Should I read Brand View or ASIN View? Use Brand View to find which queries matter across your catalog and to track share of voice over time. Switch to ASIN View when you need to fix one product, because it ties each query's funnel to a single detail page you can actually edit.
How often should I check the SQP dashboard? Weekly for the top queries on your priority ASINs, since SQP now refreshes on a weekly cadence, and monthly for a fuller review of share-of-voice trends. Reading it on a fixed schedule is what turns it from a report you glance at into a routine that catches funnel leaks early.
Read your funnel without the spreadsheets
The SQP dashboard is the clearest picture Amazon gives you of where each search term wins or loses shoppers. Read it as a funnel, watch whether your share grows or drops at each stage, and fix the first leak you find. If you would rather ask your search data questions than scan rows every week, try the Autron agent, or run a free PPC audit to see where your funnel leaks first.