Amazon Search Query Performance Report Guide
Master Amazon’s Search Query Performance report to fuel growth. Learn to access and analyze SQP data and see how Autron adds historical trends & alerts.
TL;DR: Amazon's Search Query Performance (SQP) report is a Brand Analytics tool showing the full search funnel per query: search volume, impressions, clicks, cart adds, purchases, and your share of each. Find it in Seller Central under Brands then Brand Analytics (Brand Registry required), and export to CSV to spot high-impression/low-click terms. Autron adds historical trends and alerts.
Introduction
Imagine having a backstage pass to see exactly how shoppers search for your products on Amazon — and where in the sales funnel they might be slipping away. That’s exactly what the Amazon Search Query Performance report offers brand owners. This powerful Brand Analytics SQP dashboard reveals the full customer search journey, from the initial query impression all the way to the purchase. In an ultra-competitive marketplace, understanding these search funnel metrics is crucial. Why? Because SQP data highlights where your brand is winning customers, where you’re losing them, and where untapped opportunities lie.
In this comprehensive guide, we’ll demystify Amazon’s Search Query Performance (SQP) report and show you how to get maximum value from it. You’ll learn what the SQP dashboard is and how to navigate it, how to download SQP data for deeper analysis, and five practical ways to apply these insights to grow your brand. We’ll also explore how Autron’s SQP insights dashboards take things to the next level with historical trend tracking and proactive alerts. By the end, you’ll have a clear roadmap to turn Amazon’s search data into strategic action for your brand’s growth.
What is the Amazon Search Query Performance Report?
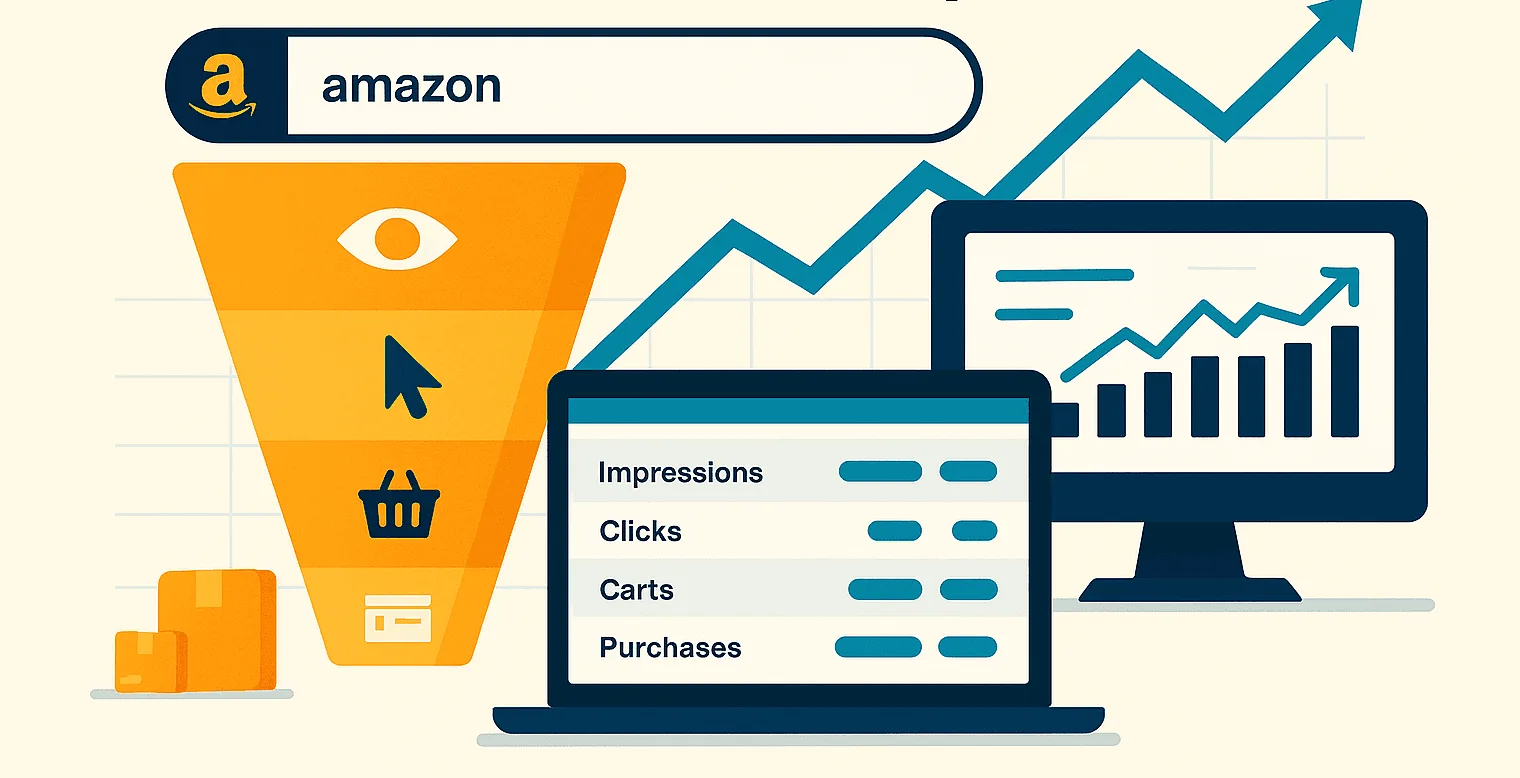
The Amazon Search Query Performance report is a Brand Analytics tool that provides first-party data on how customers discover and engage with your brand through Amazon search. In simple terms, it shows you the top search queries that led shoppers to your products, along with a wealth of metrics for each query. It’s like an X-ray of the entire search funnel — showing how many times a term was searched, how often your listings appeared (impressions), how many clicks you earned, how many shoppers added to cart, and how many ultimately purchased.
Why SQP data matters:
-
Full-funnel visibility: SQP reveals where customers drop off. For example, a query might have thousands of impressions but few clicks — indicating your product isn’t enticing shoppers to click. Or maybe you get the clicks but not conversions, signaling a detail page or price issue. This full-funnel view helps pinpoint exactly which stage needs attention.
-
Data straight from Amazon: Unlike third-party keyword tools, SQP is sourced directly from Amazon’s own data. That means you’re seeing actual shopper behavior and Brand Analytics SQP metrics, not estimates. It’s a reliable foundation for decision-making.
-
Competitive context: The dashboard doesn’t just show your numbers; it often provides total market values or share percentages. You can gauge your brand’s share of impressions, clicks, or purchases for a query versus the entire market. If your click share on a high-volume search term is only 5%, that’s a wake-up call to improve visibility or advertising.
-
Strategic keyword insights: By surfacing the exact terms customers use, SQP helps you discover new keywords to target in your Amazon SEO and PPC campaigns. It’s an ongoing keyword research tool that reflects real demand and trends, so you can optimize listings and ads accordingly.
In short, the Search Query Performance report matters because it shines a light on how shoppers find (or fail to find) your products. It guides you on where to double down and where to course-correct in your marketing strategy.
How to Access the SQP Dashboard in Seller Central

Accessing the Search Query Performance dashboard is straightforward, but you’ll need to be a brand-registered seller with the right permissions. Here’s how to find it in Amazon Seller Central:
-
Log in to your Amazon Seller Central account.
-
Navigate to the main menu and hover over Brands (visible if your account is Brand Registered).
-
Click on Brand Analytics in the drop-down menu. This will take you to the Brand Analytics page.
-
At the top of the Brand Analytics page, look for the Search Analytics section or drop-down. Select Search Query Performance from the options.
If you have multiple brands, you may need to choose the relevant brand after clicking Brand Analytics. The SQP dashboard will then load, typically defaulting to the Brand View for the most recent week of data. You can switch the time frame to monthly or quarterly, and toggle between Brand View and ASIN View (to inspect data for a specific product).
Note: Only users with Brand Registry access can see Brand Analytics. Ensure your account’s primary admin or user permissions grant you access to “Brand Analytics > Search Query Performance.” If you can’t find the SQP report, double-check that your brand is enrolled in Amazon Brand Registry and that you have the necessary rights.
Inside the Search Query Performance Dashboard
Once you open the SQP dashboard, you’ll see a table listing search queries along with their performance metrics. The interface might look overwhelming at first, but it’s actually well organized. Let’s break down what you’re looking at.
The SQP dashboard provides a list of search queries with their metrics at a glance. Each search query row includes metrics like impressions, clicks, cart adds, and purchases, as well as a Search Query Score and the total query volume. Amazon also often displays your brand’s share of those metrics for the query (for example, what percentage of all clicks on that term were on your products). These metrics together let you evaluate how well you’re capturing shoppers at each stage of the search funnel (see the Glossary at the end of this article for definitions of each metric).
Brand View vs. ASIN View: You can toggle the SQP dashboard between data for your entire brand and data for a single product (ASIN). Brand View gives you the big picture across all your products, while ASIN View shows the queries (and metrics) for one specific product.
This drill-down helps you diagnose performance at the product level. For example, you can quickly see which keywords a particular ASIN is winning or missing.
Downloading and Analyzing SQP Data
While the online dashboard is handy for a quick view, you can gain deeper insights by exporting the data. There’s a Download button on the SQP page that lets you export the report as a CSV file. Once you have that export, our free Amazon N-Gram Analyzer breaks your search queries into word-level patterns to surface wasted spend and winning themes in seconds.
Once downloaded, you can open it in Excel or another tool to analyze and manipulate the data. The CSV file contains all the query metrics in a table format for you to explore.
Here are a few quick tips for analyzing the SQP CSV:
-
Track trends over time: Save weekly or monthly reports and compare them to see how metrics change (e.g., watch if a query’s volume or your click-through rate is rising or falling).
-
Find hidden opportunities: Look for queries with high impressions but low clicks. These terms have lots of shoppers, but your listing isn’t getting attention — consider improving your title/image or running ads for those keywords.
-
Spot conversion issues: Find queries where you get plenty of clicks but few purchases. If people click but don’t buy, you likely need to fix something on your product page (better content, price, or reviews) to turn more clicks into sales.
Get the Amazon SQP Audit Checklist
A step-by-step checklist for working through your Search Query Performance export — find visibility gaps, click and conversion problems, and the winners worth defending.
5 Practical Use Cases for SQP Data
SQP data isn’t just numbers — it’s actionable intelligence for your Amazon business. Here are five ways to put it to work:
-
Discover new keywords: Find high-volume search terms your products are missing out on. These are prime targets for new ads or listing optimizations to capture more traffic.
-
Optimize listings for clicks: Spot queries where you have many impressions but few clicks. Improve your product title, images, or pricing to make your listing more enticing and boost the click-through rate.
-
Improve conversion rate: Identify queries that get a lot of clicks but not many purchases. If shoppers click but don’t buy, enhance your product page (content, price, reviews) to convert more of that traffic into sales.
-
Refine advertising campaigns: Use SQP insights to adjust your PPC strategy. Bid more aggressively on keywords that convert well, and cut spend on terms that drive clicks without sales.
-
Monitor brand health: Track your brand’s share of impressions, clicks, and purchases on important search terms. If your share drops on a key query, investigate why (a competitor might be gaining) and respond to protect your visibility.
-
Understand shifts in customer demand: Use the Search Volume trends to track how customer interest in key search terms changes over time. Rising volume may signal seasonal demand, trending products, or an emerging niche — all great opportunities to double down. Declining volume might indicate category fatigue or the need to diversify.
Autron SQP Insights: Interactive Dashboards That Unlock Deeper Search Intelligence
Autron ingests your SQP data automatically, then transforms them into an interactive Search Query & Catalog Performance dashboards that does far more than Amazon’s native table view.

Powerful Filters for Granular Views
At the top of the dashboard, Autron offers universal filters that let you slice results by date range, product category, parent ASIN, individual ASIN, and even partial or exact-match search queries. You can stack multiple filters to zero in on highly specific questions — for example, “Which queries drove purchases for ASIN X last week?” This allows you to move effortlessly from high-level overviews to precise tactical views in seconds.
Visual Table That Surfaces What Matters
Autron’s query table includes all the familiar SQP funnel metrics — impressions, clicks, cart-adds, purchases — but layers on spark-bar visuals for purchase count, share, and conversion rate. These subtle visuals make it immediately clear which queries are driving performance and which are underperforming, without needing to sort or export.
Trends That Separate Performance From Demand
A built-in “Search Trends” combo chart overlays Amazon’s search volume (blue line) with your brand’s purchase count (green bars) over time. This makes it easy to distinguish whether a sales spike came from increased demand or from improved performance during steady demand. For instance, you might notice that even as customer search volume dropped, your purchases rose — a sign your listing or ad strategy is working.
Track Sales Contribution by Query
A stacked bar view breaks down your total purchase count by query over time. This lets you monitor the relative contribution of each keyword to your sales mix — helping you identify seasonal shifts, top-of-funnel cannibalisation, or breakout performers worth doubling down on.
Monitor Share of Voice Across All Queries
Autron visualizes your share of purchases across all tracked queries, week by week. A declining line here signals eroding market presence — potentially due to new competitors — while a rising line suggests improving brand dominance in your niche.
See Which Products Convert
A bar chart summarizing “Purchase Count by ASIN” shows exactly which products are converting from your selected query set. This helps you understand which ASINs are closing the deal — and ensures you’re aligning advertising and keyword efforts to the listings that perform best.
Catalog-Level Insights for Funnel Optimization
Autron doesn’t stop at query-level data. Its Search Catalog Performance dashboard pulls in your catalog CSV and visualizes conversion patterns across your entire product range.
-
Funnel History + Trends: Visualize clicks, cart-adds, and purchases side-by-side over time to pinpoint where customers drop off. If cart adds are strong but purchases are weak, it’s likely a pricing or trust issue.
-
Momentum Waterfall Chart: Identify ASINs gaining or losing purchase volume over the last period. It’s perfect for flagging early performance declines or spotting newly surging products.
-
Bubble Charts for CTR vs CVR or Price vs CVR: These plots make it easy to find outliers — like products with great traffic but poor conversion, or items priced too high for their click performance.
What You Unlock With Autron (That Amazon Doesn’t Offer)
-
True historical analysis – No more saving old CSVs manually. Autron stores each upload, enabling rolling-period trends and comparisons.
-
Real-time, filter-driven exploration – No exporting, merging, or filtering in Excel. Just click and get insights.
-
Cross-functional alignment – Query-level and catalog-level data in one place means keyword strategy, product optimization, and PPC decisions stay aligned.
-
Stakeholder-ready visuals – Communicate wins and action items clearly with polished charts, not spreadsheets.
Bottom line: Autron transforms your Amazon SQP files into a living, breathing analytics command center. With interactive filters, historical visuals, and clear performance signals, your team will spend less time crunching and more time optimising what matters.
Case Study: Turning SQP Insights into Sales
Background: Jane, the owner of a skincare brand, noticed her flagship vitamin C serum had stagnant sales. She turned to the Search Query Performance report to investigate. Insight: SQP data revealed that for the high-volume query “vitamin C serum,” her products had very low impressions and clicks (meaning shoppers barely saw her item). Meanwhile, when people searched her brand name, many clicked but few purchased – indicating a conversion problem.
Actions: Jane optimized her product listing (title, keywords, and images) to rank better for “vitamin C serum” and launched a Sponsored Products ad campaign for that term. She also improved her detail page and pricing to boost conversion for those who showed interest. Using Autron, she tracked the impact week by week – seeing her impressions and clicks rising in Autron’s trend graphs. An Autron alert even notified her when a new competitor briefly stole some clicks, prompting Jane to adjust her ad bids.
Results: Within three months, Jane’s vitamin C serum sales jumped by 30%. The combination of Amazon’s SQP report and Autron’s historical tracking and alerts helped her identify where she was missing out, take swift action, and capture significantly more search-driven sales.
Glossary of Key SQP Metrics
Not sure about a specific metric in the SQP report? Here’s a quick glossary of key terms and metrics you’ll encounter in Amazon’s Search Query Performance dashboard:
Metric
Definition
Search Query
A word or phrase shoppers type into Amazon’s search bar. (Each row in the SQP report is one search query that led to your products.)
Search Query Score
A score Amazon assigns to each query based on how well it performed for your brand (higher score = better performance).
Search Query Volume
The total number of times that query was searched by Amazon shoppers in the selected period.
Impressions
How many times your products appeared in search results for that query (counts both organic results and ads).
Clicks
How many clicks your products received from that query’s search results.
Cart Adds
The number of times customers added your product to their cart after searching that query.
Purchases
The number of orders attributed to that query (shoppers who found your product via the query and purchased).
Conversion Rate
The percentage of clicks on your product that turned into purchases for that query.
Share of Voice
The percentage of total impressions, clicks, or purchases for that query that your brand captured. (E.g., a 10% click share means 10% of all clicks on that query were on your products.)
Conclusion
The Amazon Search Query Performance report is a game-changer for sellers who want to elevate their brand’s performance on the platform. It gives you concrete data on how customers search at each stage of the journey. By regularly reviewing your SQP dashboard, you can catch trends early, fix funnel weaknesses, and double down on what works. Pairing SQP data with Autron ensures you won’t miss a beat – Autron’s historical tracking and smart alerts keep you one step ahead of changes, almost like having a digital analyst on call 24/7.
Don’t let this treasure trove of data go unused. Dive into your Search Query Performance reports, apply the insights using the strategies we covered, and consider leveraging Autron’s advanced SQP dashboard to supercharge your efficiency. In Amazon’s hyper-competitive environment, the brands that win are the ones who turn data into action. The SQP report gives you the data — now it’s up to you to take action and drive your Amazon success story.
For more details straight from Amazon, check out Amazon’s official documentation on the Search Query Performance dashboard.
Ready to amplify your Amazon brand with data-driven insights? Try Autron’s SQP Dashboard and see how historical trends and real-time alerts can unlock new growth.